Object Configuration
Scenario: You want to configure Desigo CC objects displayed in the System Browser. These procedures will guide you through the necessary steps.

NOTE:
Any changes may require alarms to be rechecked.
Reference: For background information, see the reference section.
Prerequisites:
- System Manager is in Engineering mode.
- System Browser is in Management View.
Search for Objects
- Click Filter search
 .
.
- Open the Discipline, Type or Other drop-down list.
- Select the desired option checkboxes.
- Click the gray background or entry fields to close the dialog box.
- Click Search.
- The found objects are displayed in System Browser.
Engineer Multiple Objects Using Multi-Select
To select a number of non-adjacent objects:
- Select the first object using the mouse.
NOTE: When pressing CTRL, always the firstly selected data point in the selected items list serves as master data point.
- Press CTRL key and hold it.
- Select all other desired objects using the mouse.
To select a range of adjacent objects:
- Select the beginning of your range of objects using the mouse.
NOTE: When using the SHIFT key, always the top-most selected data point in the selected items list serves as master data point.
- Press SHIFT and hold it.
- Select the end of your range of objects using the mouse.
NOTE:
Limitation for selected items are 10000 data points for modifying data point attributes and properties attributes in the Object Configurator.
Engineer Multiple Objects in the Object Configurator Tab
- Select the objects you want to engineer.
- In the Object Configurator tab, make the desired changes.
NOTE: Grayed out parameters cannot be engineered.
- The attributes to be changed on the master data point are marked with an asterisk (*).
- Change the value.
- Click Save
 .
.
- After saving, the values of the marked attributes are written to the selected data points. Only object properties that have been changed will be logged in the Activity Log database.
NOTE 1:
Bulk engineering for data points only (not for Library objects such as Object Models and Functions).
NOTE 2:
The data point attributes in the Main expander can be bulk engineered. The Object Models of selected data points may be different, but the data points must belong to the same system.
NOTE 3:
The data point attributes in the Properties, Details, Alarm Configuration, Value Conversion and Smoothing expanders can be bulk engineered. The objects must be of the same object type, such as analog input. If different object types are selected, in the Operation tab, the message No properties (different properties) displays.
NOTE: 4
Value Conversion and Smoothing bulk engineering is possible over more than one network, but all the driver(s) must run.
- Select Project > Field Networks > [Network] > Hardware > [Device] > [Data point].
NOTE: The folder path may vary by subsystem.
- Click the Object Configurator tab.
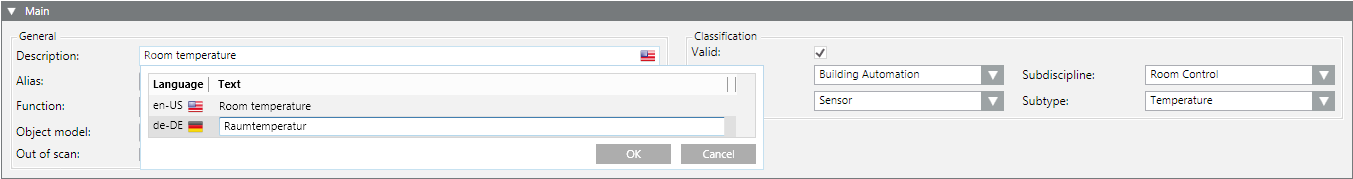
- In the Main expander, select the Descriptor field.
- Click the flag symbol.
- The text dialog box opens.
- Select the language and type as needed text for each language.
- Click OK.
- Click Save .
- Select Project > Field Networks > [Network] > Hardware > [Device] > [Data point].
NOTE: The folder path may vary by subsystem.
- Click the Object Configurator tab.
- In the Main expander, select the Alias field.
- Type a new or modify the existing alias name.
- Click Save .
NOTE:
The Alias name is termed User Designation in many other applications.
Scenario: For each system object you must define a custom text with instructions on what to do for the off-normal and normal conditions. The respective configured texts will display in the Event Text column of Event List.
- In System Browser, select the wanted view and then the wanted system object. For example, Project > Field Networks > [network] > Hardware > [device] > [data point].
NOTE: The folder path may vary depending on the subsystem.
- In the Object Configurator tab, open the Main expander.
- In the Off normal text field, enter the instructions for the off-normal condition. For example:
1. Turn off the power.
2. Replace the damaged component.
3. And so on.
- In the Normal text field, enter the instructions for the normal condition.
- Click Save .
If you configure the off-normal text only, this text will display in the Event Text column also when the system object is in normal condition. If you configure the normal text only, no text will display in the Event Text column when the system object is in off-normal condition.
Communications can be interrupted temporarily with this function if information from the subsystem is not forwarded to the management platform. This function is useful during commissioning when a building segment has been engineered but cannot be put into operation yet.


This function stops the communication between the device and the management platform but does not impact the alarm functionality. For example, an incoming alarm on a fire detection system is still forwarded to the fire department. You must take the fire detector out of commission in the Operation dialog box if you want to prevent alarm forwarding to the fire department.
Select the fire detector and then the property under Operation tab. Click Exclude to turn off an area, zone, or fire detector on the panel.
- Select Project > Field Networks > [Network] > Hardware > [Device] > [Data point].
NOTE: The folder path may vary by subsystem.
- Click the Object Configurator tab.
- In the Main expander, select the Out of scan check box.
- Click Save .
- The communications between the device and the management platform is disconnected.
- The data point in Out of Scan is no longer included in the number of data points regulated by licensing. The licensing update can take up to 10 minutes.

NOTE:
For a number of subsystems, a data point in Out of Scan results in either no alarm at all being displayed or in an unknown alarm. In the latter case, you need to identify the source of the alarm on the local fire panel. 
Search for Objects with Selected Out of Scan
- Click Filter search .
- Open the Other drop-down list.
- Select the Out of Scan checkbox and then the option Enabled.
- Click the gray background or entry fields to close the dialog box.
- Click Search.
- The found objects are displayed in System Browser.
- Click Filter search .
- Open the Other drop-down list.
- Select the Alarm Suppression checkbox and then the option Enabled.
- Click the gray background or entry fields to close the dialog box.
- Click Search.
- The found objects are displayed in System Browser.
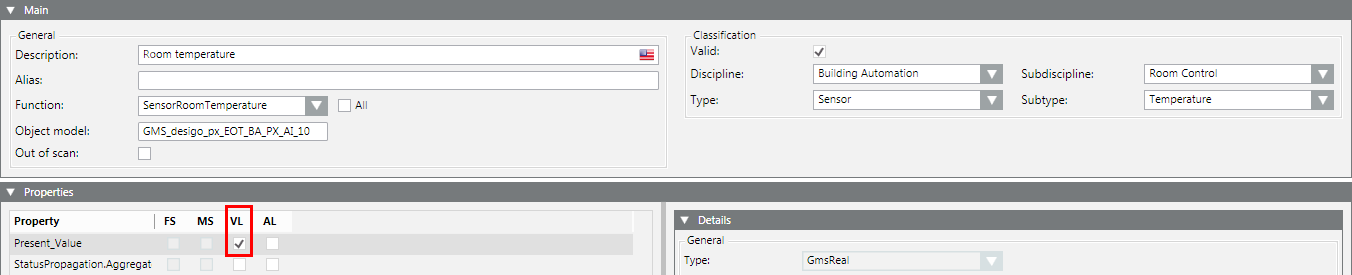
Scenario: You want to permanently log history data point value and display and evaluate at a later date as needed.
- Select Project > Field Networks > [network] > Hardware > [device] > [data point].
NOTE: The folder path may vary by subsystem.
- Click the Object Configurator tab.
- In the Properties expander, select the corresponding property (for example, Present_Value) and select the VL check box.
NOTE: The value is entered in the database for each change of state.
- (Optional) From the Archive Group drop-down-list, select an archive group.
- From the Filter Group drop-down-list, select a filter group. The selected filter group reduces the value of saved data in the history database.
- Click Save .
NOTE 1:
If you want to record a property for all instances, select the VL check box for the corresponding object model. Double-click Object Model to go to the selected instance for the object model.
For example: Project > System Settings > Libraries > BA > Specific Devices > BACnet > Object Model.
NOTE 2:
The VL check box is already selected if you have already used it to log history data point values.
NOTE 3:
When the VL check box is cleared, the values can no longer be logged for history data point values.
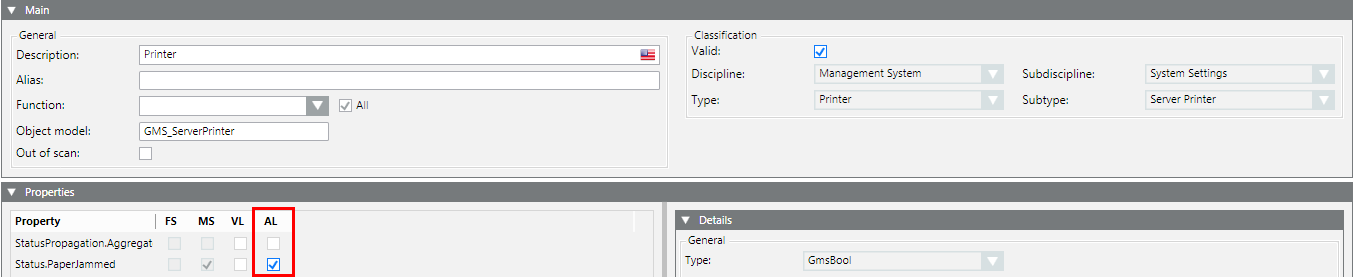
Scenario: You want to log a paper jam on a printer.
- Select Project > Management System > Servers > Main Server > Local Printer.
NOTE: The path may vary by object.
- Click the Object Configurator tab.
- In the Properties expander, select the corresponding property (for example, Status.PaperJammed) and select the AL check box.
NOTE: The value is entered in the database for each change of state.
- (Optional) Select an archive group.
- Click Save .
NOTE 1:
If you want to record a property for all instances, select the AL check box for the corresponding Object Model. Double-click in the Main expander, and then double-click Object Model to go to the Object Model. For example: Project > System Settings > Libraries > Global (HQ) > Base > Object Model > Server Station.
NOTE 2:
You must use the Log Viewer or activity log report to display data recorded in the Activity Log database.
Assign Data Points to Related Items
- Select Project > Field Networks > [Network] > Hardware > [Device] > [Data point]. This is the data point you want to add to a related item link.
NOTE: The folder path may vary by subsystem.
- In the Object Configurator tab, select the Related Items expander.
- Select the Manual navigation check box.
- Drag-and-drop the desired data point
 to the Related Items expander.
- Repeat step 4 for all desired related item links.
- Click Save .
Synchronize Related Items
- You want to link several related item links to multiple data points.
- In System Browser, select Management View.
- (Optional) Perform a filter search for a particular type of data point. See the Select Multiple Objects for Bulk Engineering section.
- Select the data point you want to synchronize.
NOTE: The data point you select first will transfer its related links configuration to the other selected data points.
- In the Object Configurator tab, select the Related Items expander.
- The expander displays the related items of the selected data point.
NOTE: These have been previously assigned. See assigning data points to related items.
- With the CTRL or SHIFT key pressed, select all data points that you want to synchronize with the first selected data point.
- Release the CTRL or SHIFT key.
- In the Related Items expander, the Add and Remove columns display.
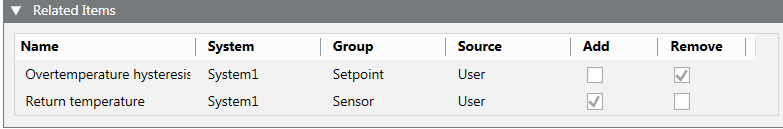
- Select the Add or Remove check boxes of each existing link. The check boxes define which information is assigned to the selected data points.
- Click Save .
- The information is assigned to the selected data points.
- Any changes to the related items of any data point are logged (in the example =!).
Example

Prioritize Related Items
Related items can influence the priority of the page to open first if a data point references multiple graphics, documents, reports, or trends. With several groups, prioritizing only works within the group.
The following description refers to prioritizing graphics pages.
- A data point is referenced on multiple graphic pages.
- Select Project > Field Networks > [Network] > Hardware > [Device] > [Data point].
NOTE: The folder path may vary by subsystem.
- The data point is selected and the graphics pages are displayed in the Related Items expander.
- Click the Object Configurator tab.
- In the Related Items expander, highlight the graphics page you want to open first.
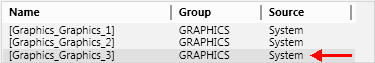
- Drag-and-drop the graphics page to the top of the list.
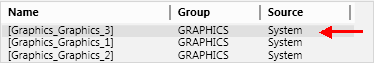
- Click Save .
- The graphics page defined at the top of the list opens.
NOTE:
The order must be set for each data point, if multiple data points are referenced on the graphics page.
Projects in a critical environment require user actions to be validated, and objects need to be labeled accordingly. The user is required to enter a comment on most actions.
Enable Application Rights for Validation
Users must have application rights to configure an object for Validation profile setting and Object version number.
- Select Project > System Settings > Security.
- Click the Security tab and select the security group to be modified.
- Open the Application Rights expander.
- Expand Object Configuration and, on the level below it, Configure Validation.
- Click Save .
Configure Objects for Validation
- You have the Application Rights to define validated objects.
- In System Browser, select Logical View.
- In the drop-down list, select the display mode (Name, description).
- In the Search
 field, enter the name of the object, for example, setpoint.
- All objects matching the search criteria are displayed in System Browser.
- Select one or more objects.
- The selected objects are highlighted in color and the number of selected objects is displayed in the Operation tab.
- Open the Object Configurator tab.
- Define, edit, or delete the validation.
Define or Edit Validation
- In the Object Configurator tab, open the Main expander.
- In the Validation profile drop-down list, select a validation profile:
NOTE: A profile can also be assigned to all objects in System Browser: for example, Users.
- (Optional) Select the Four Eyes check box. Requires user authentication (password), supervisor authentication (name and password), and a comment.
NOTE: To confirm a modification, the user must have Scope Rights Workspace in User Groups for that confirmation.
- In the Predef. comments (Predefined comments) drop-down list, select a text group. The assigned text group displays when a comment must be entered by configuration changes.
- NOTE: For more information on creating standard texts, see Adding a text group. New text groups must be refreshed by pressing the F5 key.
- (Optional) Click Change, and enter a number in the Object version field.
- Click Save .
- All selected objects are immediately validated, and the symbol
 is displayed in the Operation tab.
- The object version is automatically increased by one when saved, unless another specification was entered manually.
- Use the Audit Trail Log report to display the validation information in the Comment column.
Disable Validation
- In the Object Configurator tab, open the Main expander.
- In the Validation profile drop-down list, select Disabled.
- Click Save .
- The selected objects are no longer validated. The object version remains as is and cannot be reset.
Reset Object Version for Customer Acceptance
The object version must be reset to 0 or 1 before handing over a validated object to the customer, regardless of what the customer requests as the base value.
- In System Browser, select Logical View.
- Click Filter search .
- The Filter search dialog box displays.
- Open the Other drop-down list.
- Select Validation Profile and then the options Enabled, Supervised, Four Eyes and Monitored.
- Click the gray background or entry fields to close the dialog box.
- Click Search.
- The found objects are displayed in the System Browser.
- Select the first object.
- Press the SHIFT key and select the last object.
- All objects are highlighted and the Object Configurator tab is selected.
- In the Main expander, select the drop-down list Validation profile and Enabled.
- Click Change.
- In the Object version field, enter 0 or 1 as the base value.
- Click Save .
- In the Settings expander, select the drop-down list Validation profile, Supervised, Four Eyes and Monitored.
- Click Change.
- In the Object version field, enter 0 or 1 as the base value.
- Click Save .
- All validated objects are reset to the base value.
- Click Filter search .
- Open the Other drop-down list.
- Select the Four Eyes checkbox and then the option Enabled.
- Click the gray background or entry fields to close the dialog box.
- Click Search.
- The found objects are displayed in System Browser.
You can prevent overwriting object changes during a data import.
- In System Browser, select Logical View.
- In the drop-down list, select display mode (Name, description).
- In the field, enter the name of the object for search, for example, setpoint.
- All matching objects are displayed in the System Browser.
- Select one or more objects.
- The selected objects are highlighted in color and the number of selected objects is displayed in the Operation tab.
- Conduct one of the following actions.
Select Overwrite Protection
- In the Settings expander, select the Overwrite protection check box.
- Click Save .
- The selected objects are no longer overwritten as of this point.
Clear Overwrite Protection
- In the Settings expander, clear the Overwrite protection check box.
- Click Save .
- The selected objects are overwritten as of this point.
Search for Objects with Selected Overwrite Protection
- In System Browser, select Logical View.
- Click Filter search .
- The Filter search dialog box displays.
- Open the Other drop-down list.
- Select the Overwrite Protection check box and then option Enabled.
- Click the gray background or entry fields to close the dialog box.
- Click Search.
- The found objects are displayed in the System Browser.
Each object is assigned to a text catalog with the corresponding texts. Check the text catalog for the text contents to ensure that proper information is displayed when the state of a data point changes.
- Select Project > Field Networks > [network] > Hardware > [device] > [data point].
NOTE: The folder path may vary by subsystem.
- Click the Object Configurator tab.
- In the Properties expander, select the property (for example, Present_Value).
- In the Details expander, double-click the Unit text group description.
- The corresponding text group is selected in System Browser.
- Click the Text Group Editor tab.
- The entries for the selected text group display.
- Select Project > Field Networks > [network] > Hardware > [device] > [data point].
NOTE: The folder path may vary by subsystem.
- Click the Object Configurator tab.
- In the Main expander, change the following entries:
- 1 = Discipline
- 2 = Subdiscipline
- 3 = Type
- 4 = Subtype
- Select the Valid
 check box.
NOTE: The check box may not be green or blue.
- Click Save .
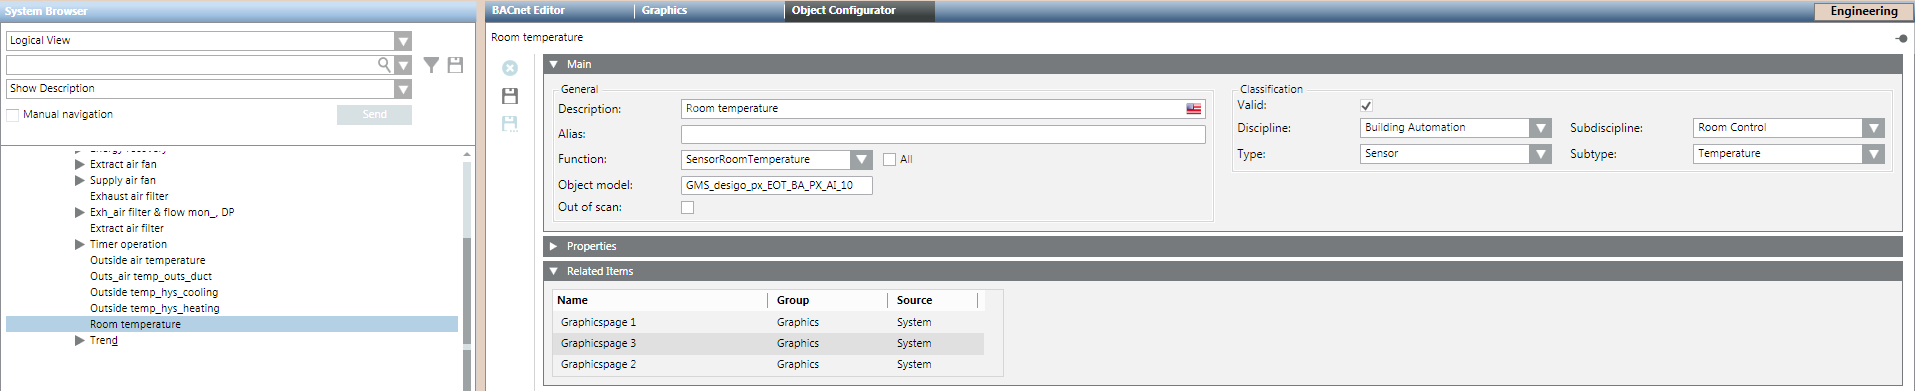
The figure below illustrates the Object Configuration entry,as well as the corresponding applications that evaluate the information.

Changes to an object assignment can have a direct impact on future alarms. After each change, check the alarm functionality of alarm.
- A data point is available in System Browser. Value conversion is only available for GMS real, float, uint, int, GMS uint and GMS int properties which display a value from a field device. It cannot, for example, be used for properties that are only available on Desigo CC .
- The driver of the network must be running. Otherwise, in the Value Conversion expander, the Valid check box displays a question mark symbol.
- Select Project > [field Networks] > [network] > Hardware > […] > [data point].
- Click the Object Configurator tab and open the Properties expander.
- Select the desired property.
- In the Value Conversion expander, select the Valid check box.
- Enter values into the following fields:
- Min raw value: the lower end of your raw value scale
- Max raw value: the upper end of your raw value scale
- Min eng. value: the lower end of your engineering value scale
- Max eng. value: the upper end of your engineering value scale
NOTE: Value conversion is applied bidirectional and applies to incoming as well as outgoing values (commanding).
- In the Operation tab, the property displays the engineering value of the current reading.
Example

If you configure the following values: Min raw value: 2, Max raw value: 10, Min eng. value: -50, Max eng. value: 50, a value of 6 on the field device will be displayed as 0 in Desigo CC.
NOTE:
- Value conversion is only available for properties originating in drivers. It is not available for SNMP.
- The procedure is also not recommended for BACnet integration. Conversion does not work for commands, such as BACnet priority-based value commanding.
Smoothing can be used to reduce volume of data stored in the system. Value smoothing is mainly used to optimize systems where data is acquired via polling, for example, Modbus integrations.
- Select Project > Field Networks > [network] > Hardware > […] > [data point].
- Click the Object Configurator tab and open the Properties expander.
- Select, for example, the Present_Value property.
- In the Smoothing expander, select the Valid check box.
- From the drop-down list, select one of the following Value Smoothing:
- Value
a. Enter a deadband.
b. From the drop-down list, select one of the following:
- unit for absolute deadband
OR
- [%] for relative deadband.
- Time
a. Enter a time interval.
- Value AND time
a. Enter a time interval.
b. Enter a deadband.
c. From the drop-down list, select one of the following:
- unit for absolute deadband
OR
- [%] for relative deadband.
- Value OR time
a. Enter a time interval.
b. Enter a deadband.
c. From the drop-down list, select one of the following:
- unit for absolute deadband
OR
- [%] for relative deadband.
- Old/new
- Old/new AND time
a. Enter a time interval.
- Old/new OR time
a. Enter a time interval.
- Click Save .
NOTE:
Smoothing is not recommended for BACnet integrations because the BACnet driver has an integrated smoothing function.
Scenario: The measured input value must be converted into a readable display value. For example, the measured value is 2000000 Watt which should be displayed as 2000 kW (or 2 MW, depending on your settings).
- Select Project > [field networks] > [network] > Hardware > […] > [data point].
- Click the Object Configurator tab and open the Details expander.
- In the Value Attributes section, do the following:
a. From the Unit text group drop-down list, select TxG_EngineeringUnits.
b. From the Unit drop-down list, select the desired unit (for example, W).
c. From the Scaled unit drop-down list, select the unit you want to convert into (for example, kW).
- In the Value Attributes section, do the following:
a. In the Min field, enter the unconverted value.
b. In the Max field, enter the unconverted value.
NOTE: The minimum and maximum values are automatically converted for applications which use those values.
- The measured value displays as a converted unit value in the application.
NOTE:
Value conversion is only available for GMS real, GMS uint and GMS int properties which display a value from a field device.
If during data import a Function cannot be assigned automatically, you must first assign it individually to the data points. This normally is the case when you integrate a third-party product.
- Select Project > Management System > Servers > Hardware > Main Server > [data point].
NOTE: The folder path may vary by subsystem.
- In the Object Configurator tab, select the Main expander.
- In the Function list, select the corresponding Function (for example, for an analog input for temperature measurement = SensorAirTemperature). Check box All means:
Cleared: Displays only the Function assigned to the Object Model in the Function Mapper.
Selected: Displays all Functions in the system.
- The data point in the system behaves according to the selected Function (for example, you selected a supply air sensor by drag-and-drop in the graphic).
- Click Save .
- The Operation tab now displays only the properties according to the selected Function configuration.
To process instances, it is helpful to be able to easily locate the corresponding function or object model in System Browser.

- You opened the corresponding instance in Object Configurator.
- In the Main expander, double-click the Function or Object model description.
- The corresponding Function or Object Model is selected and displays in System Browser. The Models & Functions tab opens.
You want to set up a management station alarm that monitors a value or range. For example, 68 ‒ 86 is the normal value range; values that are greater or less than that range will trigger an alarm.
- You have the appropriate user rights to create an alarm.
- Select Project > Field Networks > [Network] > Hardware > [Device] > [Data point].
NOTE: The folder path may vary by subsystem or selected view.
- Click the Object Configurator tab.
- In the Properties expander, select the appropriate property (for example, Present_Value).
- In the Alarm Configuration expander, select the Valid check box to display activation in grey.
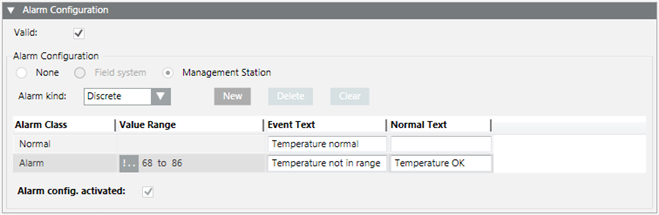
- Select the Management Station option.
- (Optional) From the Alarm flags drop-down-list, select None, No alarm on driver invalid, No alarm on source time invalid (For background information, see the Alarm Configuration Expander reference section).
- In the Alarm kind drop-down list select Discrete.
- Click New to define a new alarm class.
- Define the corresponding conditions for each alarm class:
a. Select the Alarm Class type.
b. In the Value Range column, select the operand.
c. In the Value Range column, select the values.
For example, the range 100 through 200 and 200 through 300. Entering 100 through 199 and 200 through 299 creates a gap in monitoring from 199.001 to 199.999.
d. Enter the necessary information in the Event Text field and Normal Text field. Depending on your assigned event profile, the alarm lamps maybe different as in the picture
e. Select the Alarm config. activated check box.
- Click Save .
NOTE:
The limit values are only monitored when the following conditions are met:
- In the Alarm Configuration expander, the Alarm config. activated check box is selected.
- In the Main expander, the Out of scan check box is deselected.
- The entries are saved.
Supported Operands | ||
Operand | Meaning | Example |
> | Greater than |
|
< | Less than |
|
>= | Greater than or equal to |
|
<= | Less than or equal to |
|


Fault indication
- The value sequence is not ascending. A valid value must be less than 50.
Example: Door and Window Monitoring
You can easily monitor a door by selecting the door contact input (Present_Value) in System Browser. Define the open state of the doors. For example, a !|| ACTIVE. A message is sent if the doors are opened.
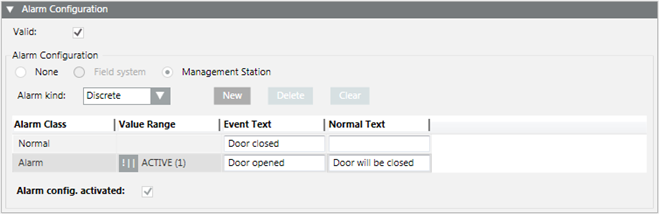
NOTE:
The operands || or !|| depends on the contact function (normally open, normally closed).
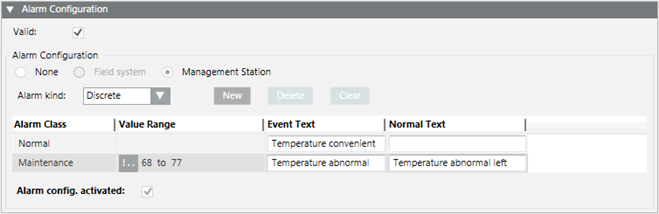
Example: Simple Temperature Monitoring
You can easily create a simple temperature monitor by selecting the temperature sensor (Present _Value) in System Browser. Define the desired comfort temperature range. For example, !.. 68 to 77. The corresponding message is sent out if the value is breached or exceeded.
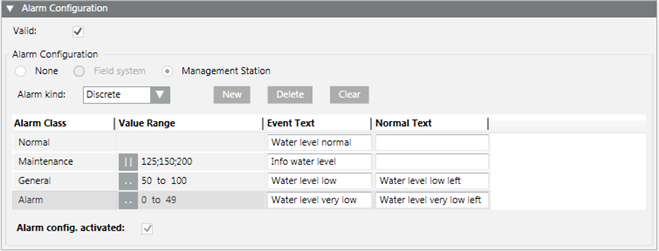
Example: Level Monitoring
You can easily create a level monitor by selecting the level sensor (Present_Value) in System Browser. Define a corresponding message for each level. The corresponding message is sent out when the set values are reached. In this case, the value for 125, 150 or 200 must be precisely changed to send out a message.
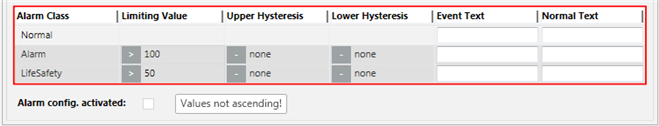
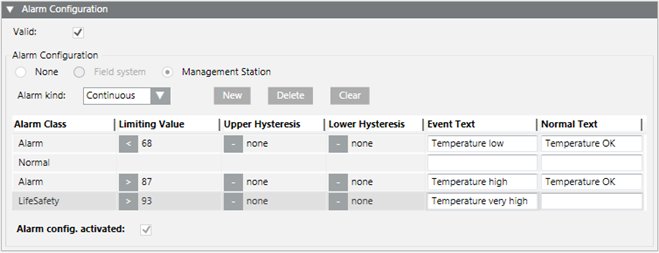
You want to set up a management station alarm that monitors a value (for example, > 87).
- You have the appropriate user rights to create an alarm.
- Select Project > Field Networks > [Network] > Hardware > [Device] > [Data point].
NOTE: The folder path may vary by subsystem or selected view.
- Click the Object Configurator tab.
- In the Properties expander, select the appropriate property (for example, Present_Value).
- In the Alarm Configuration expander, select the Valid check box to display activation in grey.
- Select the Management Station option.
- (Optional) From the Alarm flags drop-down-list, select None, No alarm on driver invalid, No alarm on source time invalid (for background information, see the Alarm Configuration Expander reference section).
- In the Alarm kind drop-down list, select Continuous.
- Click New to define a new alarm class.
- Define the corresponding conditions for each alarm class:
a. Select the Alarm Class type.
b. In the Limiting Value column, select the operand.
c. In the Limiting Value column, select the value.
d. (Optional) Enter the value in the Upper Hysteresis and/or Lower Hysteresis columns. Entering a hysteresis prevents the triggering of an alarm each time there is a slight variation.
e. Enter the necessary information in the Event Text field and Normal Text field. Depending on your assigned event profile, the alarm lamps maybe different as in the picture.
f. Select the Alarm config. activated check box.
- Click Save .
NOTE:
The limit values are only monitored when the following conditions are met:
- In the Alarm Configuration expander, the Alarm config. activated check box is selected.
- In the Main expander, the Out of scan check box is deselected.
- The entries are saved.
Functionality of Hysteresis
The alarm triggers according to the set threshold value if a Upper Hysteresis and Lower Hysteresis entered on the selected setpoint. Hysteresis allows the user to incorporate tolerance in the alarm levels. In the following image, hysteresis is used to define the alarm conditions.

Explanation of Hysteresis Behavior | |
| Description |
A | The point goes into alarm because the value has crossed the Upper Hysteresis of the High Temperature alarm. |
B | The point returns to normal because the value has returned to Normal Temperature. |
C | Notice that the point did not go into alarm as it reached a value lower than the Low Temperature value. Because it did not cross the Lower Hysteresis, it did not trigger the alarm. |
D | The point goes into alarm because, again, the value has crossed the Upper Hysteresis of the High Temperature alarm. |
E | Notice that the point did not come out of alarm as it fluctuated. It remained in alarm until it crossed the Lower Hysteresis. |
F | The point returns to normal because the value has returned to the Normal Temperature condition. |
G | The point goes into alarm because the value has crossed the Lower Hysteresis of the Low Temperature alarm. |
H | The point returns to normal because the value has returned to the Normal Temperature condition. |
Entry of alarm configuration for an alarm high and low:

Supported Operands | ||
Operand | Meaning | Example |
> | Greater than |
|
< | Less than |
|
>= | Greater than or equal to |
|
<= | Less than or equal to |
|
Fault indication
- The value sequence is not ascending. A valid value must be less than 50.
Example: Advanced Temperature Monitoring
You can easily create an advanced temperature monitor by selecting the temperature sensor (Present_Value) in System Browser. Define a corresponding message for each temperature limit. The corresponding message is sent out when the set values are reached. Use the Hysteresis columns to avoid triggering additional messages for slight temperature deviations.
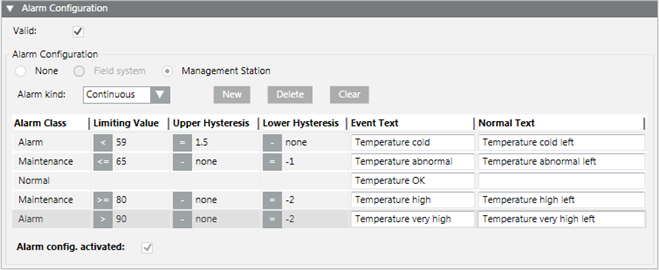
NOTE:
You can define only one normal range. First create the corresponding number of alarm classes and then select the corresponding position for normal range.
You want to create a management station alarm that monitors a 32 BitString data point value. For example, the states High limit and Fault could trigger the alarm State (Client profile BA_EN). Both TRUE conditions must be met to trigger the State alarm. All other possible state combinations do not trigger an alarm.
Create Alarm Configuration
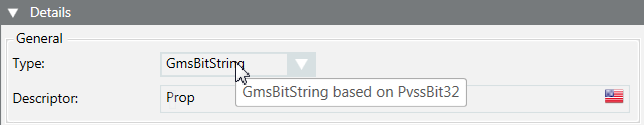
- The data point must be type GmsBitString based on PvssBit32 to be able to configure a BitString alarm (see Step 4).
- Select Project > Field Networks > [network] > Hardware > [device] > [data point].
NOTE: The folder path may vary by subsystem or view.
- Click the Configurator tab.
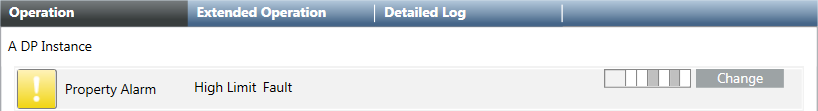
- In the Properties expander, select the relevant Property (for example, Property Alarm).
- In the Details expander and in the General group box, check the Type. The data type GmsBitString based on PvssBit32 must display in the tool tip.
- In the Alarm Configuration expander, select Valid. The activation is displayed in gray.
- Select the Management Station option.
- The selection for Alarm Type is not possible in the drop-down list.
- (Optional) From the Alarm flags drop-down-list, select None, No alarm on driver invalid, No alarm on source time invalid (for background information, see the Alarm Configuration Expander reference section).
- Click New for a new alarm class.
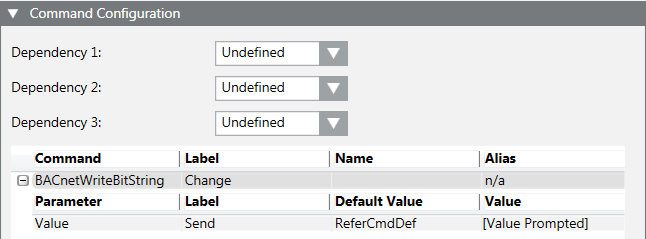
- Set the conditions for each alarm class:
a. Select the Alarm Class type.
b. In the Value range column, select the Operand
c. In the Value range column, click the checkbox.
d. Open the selection pane and activate the corresponding BitStrings. The activated BitStrings act as an AND condition. All activated BitStrings must be TRUE to trigger an alarm. In the following example, these are Fault (1) and High Limit (2).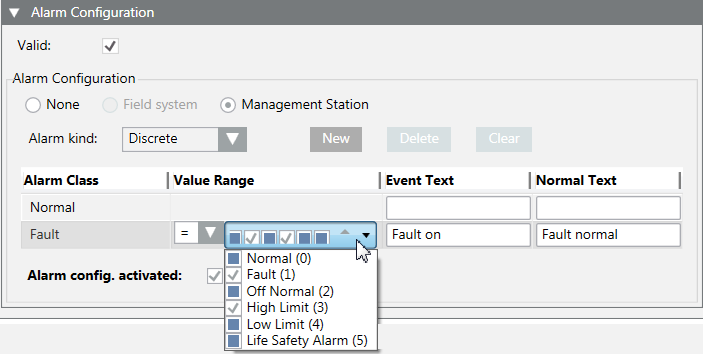 .
.
e. Enter the required information in Alarm text and Normal text fields. Depending on your assigned event profile, the alarm lamps maybe different as in the picture.
f. Select the checkbox Activate device recognition.
- (Optional) Repeat Step 9 if additional conditions are required.
NOTE: The alarm with the highest alarm priority must be defined at the bottom if multiple alarm conditions are defined because alarm processing occurs from bottom to top. The remaining alarm definitions are no longer evaluated as soon as a condition is met.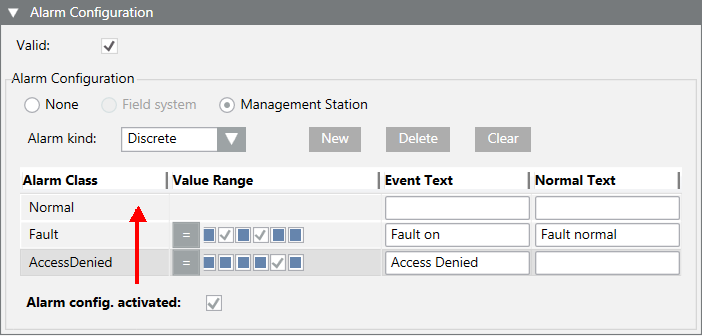
- Click Save .
- The alarm configuration is concluded and can not be tested.
Test the Alarm Configuration and Triggering the Alarm
- The object model must have a button for commanding to be tested. Select the object model and define for BACnet BACnetWriteBitString or GenericWriteBitString.
- Select Project > Field Networks > [network name] > Hardware > [device name] > [data point].
NOTE: The folder path may vary by subsystem or view.
- Do one of the following:
a. In the context area, click the Operation tab.
b. Select the corresponding property (for example: Property Alarm).
c. In the BitString mask, activate Fault and Top limit (the states are displayed in the tool tip). The selected boxes are displayed in gray. In contrast to alarm configuration, note that the states are displayed from right to left
d. Click Change.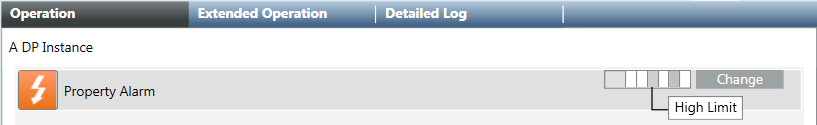
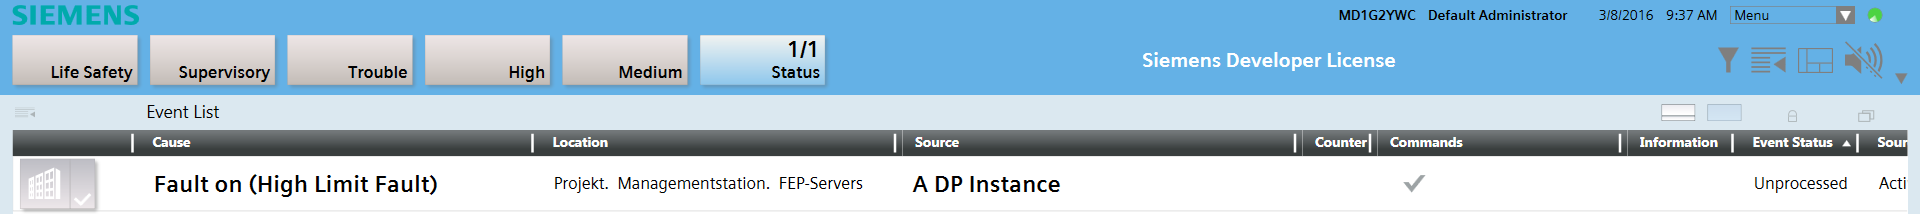
- The alarm is triggered and displayed in the Alarm Summary bar under the alarm category State. In the Cause column, the defined alarm text Fault on as well as the two defined conditions in parenthesis (Top limit Fault) are displayed.
Acknowledge and Reset Alarm
- The alarm is triggered and displayed in alarm category State 1/1.
- On the Alarm Summary bar, click alarm category State.
- A filtered alarm list is displayed.
- In the Commands column, click Acknowledge
 .
.
- The next action is displayed in the Alarm state column.
- Select Project > Field Networks > [network name] > Hardware > [device name] > [data point].
- Do the following:
a. In the context area, click the Operation tab.
b. Select the corresponding property (for example: Property Alarm).
c. In the BitString mask, deactivate Fault and Top limit (the states are displayed in the tool tip). The selected boxes are displayed in white.
d. Click Change.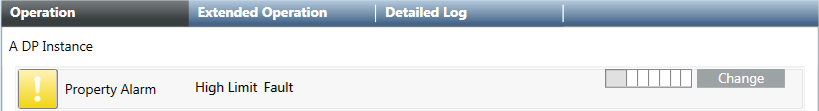
- In the Commands column, click Reset
 .
.
- The alarm is removed from the Alarm Summary bar and symbol returns to normal state in the Operation tab.
- Click the Detail log tab. The executed commands and resulting states can be printed for logging purposes.

Information on how BitString Alarms Work
- Data type
Only the GmsBitString based on PvssBit32 data type support this alarm function. The data type GmsEnum based on PvssUInt is mostly used in existing libraries; they cannot be used for this BitString alarming.
- Text groups
The referenced text group must be defined in ascending order and without gaps and cannot have more than 32 entries:
− Valid text group: 0, 1, 2, 3, 4, 5
− Invalid text group: 0, 5, 6, 8, 9, 10
Click the checkbox to display and review a selected text group. An invalid text groups is framed in red.

- Check the content of a text group.
- Select the Object Model.
- In the Details expander, click Text group.
- The Text group editor opens and the content is displayed.

- Evaluation of the BitString masks
In the alarm definition, how the bit must be set for alarming is defined for each bit. An alarm is triggered in the following example only for Situation 2 and Situation 4. The BitString mask no longer matches the alarm definition for Situation 1 and Situation 3.
Example of possible Bit states | ||||||
Text group Fault | Bit | Alarm definition | Situation 1 | Situation 2 | Situation 3 | Situation 4 |
Normal | 0 | 0 | 0 | 0 | 0 | 0 |
Fault | 1 | 1 | 0 | 1 | 1 | 1 |
Off-normal | 2 | 0 | 0 | 0 | 0 | 1 |
High limit | 3 | 1 | 1 | 1 | 0 | 1 |
Low limit | 4 | 0 | 0 | 0 | 0 | 0 |
Pers.-Alarm | 5 | 0 | 0 | 0 | 0 | 0 |
|
|
| − | Alarm | − | Alarm |
If, after an alarm is triggered (Situation 2) another bit change occurs, for example, at bit 2 (Situation 4), the triggered alarm remains pending until acknowledged. The alarm can only be reset if bit 1 and 3 return to state 0.
If bit 2 is set first for situation 4, the alarming only occurs if bit 1 and bit 3 are subsequently set.
- Select Project > System Settings > Libraries > L1-Headquarter > Global > Events > Schemas > [schema name].
- Click the Event Schema tab.
- Open the Event Mapping expander.
- The mapping table of the alarm classes to the alarm categories displays.